

Our offices: Net zero carbon 2021-22

Total of 2 people

We’re proud to report that the house built for - and lived in by - Max has achieved net zero carbon in line with the UKGBC’s Net Zero Carbon Buildings Framework, for both construction and operational energy related emissions.
As far as we are aware, this is the first home to have achieved this, and the first building of any type to achieve net zero for both embodied and operational energy related emissions.
Max, who sadly passed away earlier this year, was an integral member of the design team for the project. In some ways, the building is an embodiment of the passive design ideas that Max pioneered throughout his life and career.
This article presents how the project has achieved net zero carbon status in accordance with the UKGBC Net Zero Carbon Building Framework. In general terms, the work required designing, constructing, and operating the building to achieve target values for low embodied carbon and low operational energy consumption. It also required maximising renewable energy supply, measuring the performance in use, analysing the data, purchasing carbon offsetting to reach net zero, writing a report compiling the evidence demonstrating net zero status, appointing a 3rd Party Verifier to audit the work against the UKGBC requirements, and finally disclosing/publishing the work online (this article).
The scope and timings of net zero carbon are:
Construction (upfront embodied) related emissions at Practical Completion.
Operational energy related emissions Jan 01 2020 to Dec 31 2020.
In addition to describing how the project achieved net zero carbon, this article also includes commentary on the design of current and future net zero carbon homes, informed by the insights gained on the analysis of Max’s house.
The building is a mid-terrace, single dwelling located in London, UK. The building is a certified Passivhaus incorporating exemplary standards of insulation, draught proofing and other low energy design features. Services include high efficiency MVHR, a heat pump for hot water generation, and a roof mounted PV array. The project was predominantly new-build with some elements of existing structures re-used in place. Low embodied carbon design strategies include concrete with 50% GGBS low carbon cement replacement and many elements from natural materials; such as timber roof structure, window frames, and façade cladding.
Further information on the design and construction of the building can be found at the following sites:
The net zero carbon project team includes the project lead designer Bere:architects, Price and Myers structural engineers, Sogo Solar, Bow Tie Construction, Mr Finn Fordham and ourselves, Max Fordham LLP. Max Fordham LLP provided Passivhaus design, M&E design, and the post occupancy energy and net zero carbon analyses and reporting. The UKGBC net zero carbon 3rd party verification was carried out by Circular Ecology.

Max in his new home
© Lydia Goldblatt 2019
Total of 4 images

Maxs house is built behind the existing brick garden wall
© Tim Crocker

© Tim Crocker

© Tim Crocker

© Tim Crocker
The UK Green Building Council have published a set of documents that define what net zero carbon buildings are, and set out what buildings and their users need to do in order achieve net zero carbon. The UKGBC Renewable Energy Procurement & Carbon Offsetting Guide for Net Zero Carbon Buildings provides the detailed requirements. The diagram below (taken from that document) explains the key steps:

Steps to achieving a UKGBC Net Zero Carbon Building. Infographic from the UKGBC Renewable Energy Procurement & Carbon Offsetting Guide. Note: “construction impacts” described in the above are also known as embodied carbon emissions
The UKGBC also publish the Net Zero Carbon Buildings: Levels of Performance Primer. This document provides further details and the best summary of what buildings need to achieve (and what they must avoid) to be able to claim net zero carbon in line with the UKGBC's framework.
The following sections of this article describe the approaches taken for Max Fordham house, to meet the requirements set out in the UKGBC documents cited.

Residential building annual energy targets for net zero carbon compatible houses. Excerpt from RIBA 2030 Climate Challenge (V2).
How to measure operational energy consumption
An aspect that isn’t obvious is the definition of operational energy consumption that one must use. There are two key components:
a) that it includes (nearly) all energy uses, both regulated and unregulated, and
b) that it includes all energy consumption irrespective of the source.
Examples of regulated energy uses are heating, domestic hot water generation and lighting. Examples of unregulated energy uses are fridges, freezers, cookers, TVs and computers. All these types of energy uses are to be included in the total when comparing to the interim target. However, an aspect that would need to be excluded is energy used for electric vehicle charging.
The second condition, the source of energy, relates to the situation where a building has on-site generation. For Max Fordham house, as is the case for many buildings, this is provided by a roof mounted solar photovoltaic array that generates electricity. The complexity is that some of the PV generated electricity goes into powering the building (when demand and generation occur at the same time) and some of the PV generated electricity is exported to the national grid (at times when the amount of generation exceeds the needs of the building). Only the first part, the fraction of on-site generation that is used on site, contributes to the building's operational energy total.
In most buildings (especially dwellings) not all of the individual ways of the electrical distribution board (consumer unit) will be metered. In this case, in order to know what the building's total operational energy consumption is from the combination of grid import and on-site PV generation, it is required to have an export meter and to do a bit of arithmetic. The diagram below illustrates the concept.
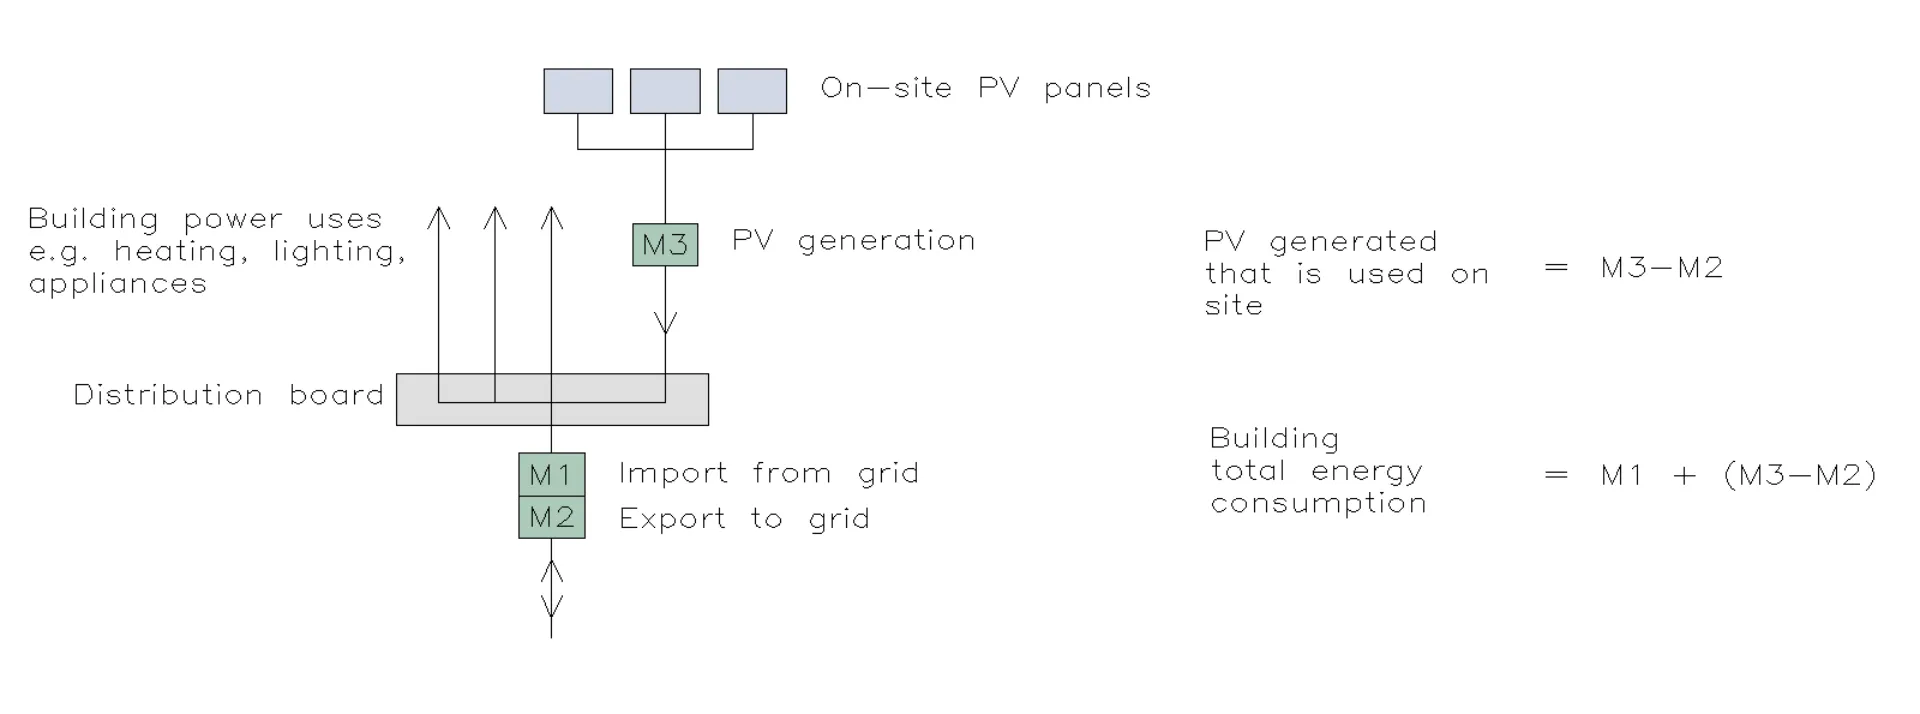
Metering system used to determine the building total operational energy consumption from the combination of grid imported electricity and on-site PV generated electricity.
Measured energy consumption
At Max’s house, the types of meters illustrated are present, whilst the data logging and analysis is provided by a part of the PV system; a Solar Edge inverter and energy monitoring system. The image below shows the monitored energy data output from the Solar Edge system for the period 01/01/2020 to 31/12/2020. i.e. the calendar year 2020.

As-measured energy data for the year 2020, incorporating grid import, on-site PV generation, export, and total consumption.
As expected, the data shows higher energy demands in winter than summer and the highest PV generation (solar production) in summer. The data shows that all solar energy generated in winter was used on site (zero export), but between February and September some fraction of generated solar energy was exported, i.e. didn’t contribute to the building consumption.
The total building annual consumption was 8.1 MWh. For Max’s house, this equates to 48 kWh/m²/yr, 20% less than the required net zero carbon compatible RIBA 2025 target of 60 kWh/m²/yr.
The chart below shows the as-measured energy performance of the building for the years 2019 and 2020. The results combine data from the Solar Edge system along with sub meter data from the supplies to the in-duct space heater and the domestic hot water heat pump.
As previously mentioned, the total building annual consumption during 2020 was 48 kWh/m²/yr. For 2019, it was 55 kWh/m²/yr, also less than the net zero carbon compatible RIBA 2025 target of 60 kWh/m²/yr.

As-measured energy data. Consumption and supply for the years 2019 and 2020. 2019 results are based on 8 months data extrapolated to 12 months. Furthermore, the space heating and DHW values are approximate because the data collection periods for these slightly different to those of the corresponding building totals.
Other observations include the following:
The space heating demand in 2019 was 12 kWh/m²/yr. This is consistent with the Passivhaus approach that predicted the same value at design stage.
The DHW demand is significantly higher than predicted at design stage. We think the most probable reasons for this are: more hot water being used than the design stage assumption, and the heat pump having worse wintertime COP than the design stage assumption.
During 2020, the space heating demand fell to a very low value whilst the DHW demand increased. It’s not clear why this would be. Are heat losses from the DHW system somehow heating the house?
In both years, the power consumption for all other items is dominant. This includes power for lighting, MVHR fans, cooking, appliances, TV, computers, phone charging and any other item using power in the house.
There is also the possibility that some electric vehicle charging may have taken place. This aspect is not sub-metered so we can’t know.
Total PV generation in 2019 was estimated at 6 MWh/hr, whereas in 2020 it was measured at 4 MWh/yr. This extent of drop off implies there could be an issue with the system. The panels may need cleaning.
Looking ahead, to the design of current and future net zero homes, based on the insight gained on this project, we’d suggest the following be considered:
Using newly available single stage heat pump technology would probably reduce the energy required for DHW production.
Heat pump, rather than direct electric heating for the space heating heater battery, could be considered. However, the additional losses (and cost) would need to be considered.
The use of best-in-class energy efficiency kitchen appliances and cooking equipment.
The use automatic controls that switch off all non-essential items when not in use.
Separate metered ways for electric vehicle charging.
Incorporating batteries to be able to increase the on-site PV use. The benefit is that it increases the likelihood that one can secure a High Quality Green Tariff for grid supply.
Renewable electricity procurement
The building makes use of all the suitable roof space for PV panels and houses a 24m² array. For 2020, the year of the net zero verification, the total generation was 3.7 MWh. The fraction of this that was used on site (self-consumption) was 1.9 MWh, which represents 24% of the building total annual demand of 8.1 MWh. So, 24% of the building total energy consumption was provided by on-site renewable electricity.
The remaining 76% of annual energy demand was provided by electricity imported via the national grid. The building was (and still is) supplied using a tariff from Good Energy that is one of the few tariff types approved by the UKGBC as being a genuine 100% renewable High Quality Green Tariff. The other approved High Quality Green Tariffs include certain types from Green Energy UK and Ecotricity (and there could be others too). In general, the “renewable” or “green” electrify tariff types offered by most suppliers don’t meet the quality standards required to be deemed a UKGBC High Quality Green Tariif. The reasons are varied, but often include a lack of “additionality”; that is, they don’t reinvest enough funds into building new renewable energy generators (e.g. wind turbines, solar farms etc).
Through the combination of on-site PV and High Quality Green Tariff electricity via the national grid, 100% of the building’s operational energy consumption is met by renewable sources.
An additional 1.8 MWh of PV generated electricity was exported. The UKGBC net zero framework allows one to take into account the avoided emissions this brings, however on this project that wasn’t necessary because, even without this, the building is net zero carbon for operational energy.
Offsetting
Max Fordham House is powered by 100% genuine renewable energy, so no offsetting is required to reach net zero for operational energy related emissions.

Interim and future UPFRONT embodied carbon targets adapted from information published in the LETI / RIBA / WLCN / IStructE Embodied Carbon Target Alignment document. The target for Max Fordham house, which was designed in 2016, is 640 kgCO2e/m², A1-A5.
Lifecycle embodied carbon target (A1-B5 & C1-C4)
Whist not required for the UKGBC net zero verification, we also assessed the lifecycle embodied carbon emissions, those represented by LCA stages A1-B5 & C1-C4. In addition to the emissions incurred at practical completion, this scope also includes emissions associated with component replacements over the building lifetime, refrigerant leakage and demolition and disposal at end of life.
We, again, made use of the LETI / RIBA / WLCN / IStructE Embodied Carbon Target Alignment document and used a similar interpolation technique to define a project specific target. The information and process are illustrated in the diagram below. The RIBA-type lifecycle embodied carbon targets relate to the year the building was built. The target for Max Fordham house, that completed construction in 2019, is 1040 kgCO2e/m², A1-B5 & C1-C4.

Interim and future LIFECYCLE embodied carbon targets adapted from information published in the LETI / RIBA / WLCN / IStructE Embodied Carbon Target Alignment document. The target for Max Fordham house, for which construction was completed 2019, is 1040 kgCO2e/m², A1-B5 & C1-C4.
Embodied carbon modelling: Methods
As per the requirements of the UKGBC Net Zero Carbon Building Framework, the embodied carbon modelling was carried out using the RICS WLC method described in RICS Professional Statement: Whole Life Carbon Assessment For The Built Environment. The modelling used the as-built building information for the specifications and quantities of materials and components. In addition to the production stage (A1-A3) emissions, the embodied carbon scope also includes estimates of the emissions due to transport of materials to site (A4) and emissions due to waste of material and site energy a fuel (A5).
For the lifecycle scope analysis, a hypothetical 60-year building lifetime is assumed for the purpose of comparing to the target values. This doesn’t mean the building will need to be demolished after 60 years; in fact, based on the design it is anticipated Max Fordham house could last much longer than 60 years.
The lifecycle embodied carbon scope includes contributions from the replacement of building components based on the assumed component service life. End of life processes such as demolition, disposal or recycling are also included.
As per the requirements of the LETI / RIBA target alignment method, biogenic carbon sequestration is excluded from the upfront (A1-A5) embodied carbon calculations. For the lifecycle (A1-B5 & C1-C4) scope, sequestration is included with the assumption that the end-of-life scenario for timber material is incineration without carbon capture. That is, at end-of-life, the carbon sequestered within timber products is released to the atmosphere as CO2 during incineration. The net effect is zero contribution to the building lifecycle embodied carbon emissions.
The UKGBC net zero verification process requires detailed embodied carbon modelling assumptions to be reported. These can be found in our full report and include aspects such as the approach to calculating quantities, the choice of embodied carbon data sources (e.g. EPDs), assumed transport methods and distances, assumed waste quantities, assumed site energy and fuel use, assumed component services lives, assumed refrigerant types and leakage rates, assumptions relating to future grid decarbonisation.
The following drawings illustrate the approach to the embodied carbon modelling work. Specifically, how (some of) the design team information was interpreted to assemble the embodied carbon model and how the building elements are assigned to the various RICS categories that feature in the results.

Example of how architectural design information relates to the embodied carbon model. Drawing adapted from original by Bere: architects.

Example of how structural design information relates to the embodied carbon model. Drawing adapted from original by Price and Myers structural engineers.

Example of how MEP building services design information relates to the embodied carbon model.
Embodied carbon modelling: The Results
The embodied carbon modelling produced the following results:

Embodied carbon modelling: The Results
The results show that the both the upfront and lifecycle embodied carbon emissions for the building are less than the required/recommended net zero carbon compatible interim target values, by 5% and 15% respectively. The total upfront embodied carbon emissions are calculated to be 102 tCO2e, A1-A5. This is the amount that needs to be offset to achieve net zero.
Further modelling results providing insight on how the different parts of the building contribute to the building total embodied carbon emissions are illustrated in the following charts. Also included are comparisons to the future LETI-type and RIBA-type embodied carbon targets. That is, the standards that houses being designed now and due to be constructed in the future are recommended to achieve to be net zero carbon compatible.

Embodied carbon modelling results. Upfront stages (A1-A5).
The results above show that 20 products account for around 80% of the production stage (A1-A3) building total embodied emissions. Concrete (including re-bar) accounts for around 45% of the total. This demonstrates the importance of the GGBS low carbon cement replacement in this project’s embodied carbon strategy. Without it, the embodied emissions of the concrete would nearly double, significantly increasing the total embodied carbon footprint of the whole building. Looking ahead to the design of future buildings, it is important to minimise the use of concrete because using high proportions of GGBS (of fly ash) cement replacement are probably not a sustainable long term solution.
Another major contributor are insulation products, accounting for 15% of the production stage total.

Embodied carbon modelling results. Upfront stages (A1-A5).

Embodied carbon modelling results. Lifecycle stages (A1-B5 & C1-C4)
The detailed results show significant contributions in the structural concrete elements, the external walls and the services. The services, as a single category, is a bit misleading because it is made up of a large number of sub-elements with no single element making more that a 1% contribution.
Looking ahead, thinking about implications for the design and construction of future buildings, if one wanted to reduce the embodied carbon rating of a similar new build house, based on the insight provided by this modelling exercise, we’d suggest the following be considered:
Reduce building form factor (ratio of external envelope area to internal floor area). This would have several benefits: it would reduce the amount of insulation required for the same level of heat loss, it would increase the amount of habitable area for a similar structural embodied footprint. Resulting in a significant reduction to the kgCO2e/m² rating.
Look for ways that the amount of concrete could be reduced. Are there alternative designs that still provide adequate thermal mass?
Look for alternative low carbon cement replacements. Could limestone be an option?
Could the external wall build-up be simplified? Would it be possible to combine the internal Pavatex and Rockwool layers into a single layer?
Would it be possible and beneficial to use timber frame rather than concrete block walls?
Use a simpler heat pump design, smaller single stage unit with low GWP refrigerant. New products now available facilitate this.
The building is powered by 100% genuine renewable energy, so no offsetting is required to achieve net zero carbon for operational energy related emissions.
The as-built calculated upfront embodied emissions were 102 tCO2e. This is the amount needed to be offset to achieve net zero for Construction (upfront embodied) related emissions.
The project followed the UKGBC Leadership Transition Fund approach voluntarily paying a carbon price of 70 £/tCO2e. This is much more expensive than typical carbon offset sale prices and means that the project purchases about five times more offsetting than the minimum required to achieve net zero. The motivations for this are a) it is thought that £70 £/tCO2e is a more accurate representation of the cost needed for the UK to achieve its net zero climate goals and b) it accelerates funding and progress on projects that are aligned with the global transition to net zero carbon.
Using the 70 £/tCO2e price, the project full transition fund was £7,140. This funded the purchase of 455 tCO2e of Gold Standard offsets at an average cost of 15.70 £/tCO2e.
The diagram below illustrates the Leadership Transition Fund concept for this project.

The Leadership Transition Fund concept for Max Fordham House
The UKGBC method requires the Residual Carbon Balance to be offset using a verified carbon standard (such as Gold Standard or VCS) but allows the Remainder of the Transition Fund to be met using non-verified offset-type projects (for example, PIU credits). However, on this occasion, it was decided to use verified offsets for the full transition fund. The following offset projects were purchased
Planting Biodiverse Forests in Panama: Gold Standard: 200 VER units
100.5 MW Wind Power Project in Madhya Pradesh, India: Gold Standard: 255 VER units
That is, 455 offset units at an average sale price of 15.70 £/tCO2e meet the full transition fund of £7,140 using the 70 £/tCO2e leadership approach to achieve net zero carbon for the upfront embodied emissions.
To achieve UKGBC verification it is required to provide a detailed write up of the project with a body of supporting evidence to demonstrate the legitimacy of the claims to net zero carbon. This package of information must be audited by a 3rd Party who interrogates the work and provides their judgement on whether the project has or has not met the requirements of the UKGBC's Net Zero Carbon Building Framework. The audit for this project was by Dr Craig Jones at Circular Ecology.
The full UKGBC net zero carbon report for Max Fordham House can be downloaded here.
Circular Ecology’s 3rd Party verification statement can be downloaded here.
Many thanks to Bere: architects, Price and Myers and Sogo Solar for providing design and energy data information to allow the net zero analyses to take place. A special thank you to Price and Myers for their generous contribution to the offsetting costs. Thank you to Craig Jones at Circular Ecology for the careful auditing and constructive criticism. Thank you to Finn Fordham for supporting the project from inception to completion. And last, but certainly not least, thank you to the late Mr Max Fordham, without whom none of this could have happened.

