New Metrics for Communal Heating Design
By Bertie Dixon
17 July 2018
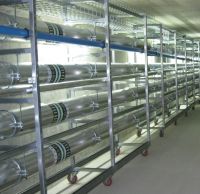
Max Fordham worked on a recently completed Passivhaus apartment building in London, where communal heating was required by policy. Part of the Passivhaus approach is to measure actual performance and relate it back to design. Any modern well-insulated building is at risk of overheating if it has an inefficient communal heating system, so, we knew we absolutely had to get the communal heating design right.
All homes require a constant supply of heat for hygiene and comfort. If the house or flat has its own boiler we call that individual heating. When a single large boiler serves many flats in an apartment block we call that Communal heating (CH). When many buildings are served by one boiler, we call it district heating (DH). Hot primary water pipes deliver the heat to each customer.
If, for example, an industrial waste heat source is located to many homes, CH/DH can facilitate low carbon heating. CH is often well suited for tall buildings. EU & UK energy policy strongly favours CH & DH. It is therefore predominant in major developments in dense areas.
For these reasons, Communal heating schemes are heralded by some as the future of heat. But does the industry understand how well do the schemes work, in practice? We feel that the way Communal and District heating are performance measured is incomplete and therefore inappropriate.
The MAX:R+I webpage goes into the following in detail:
- We describe a typical system, and identify where the heat is lost.
- We suggest ways to design efficient systems, using the recent project as an example.
- We offer some improved metrics and a method to measure performance.
- We compare the metrics to measured data from the recent project, and to national measured data.
- We compare the metrics to commonly used ‘default’ efficiencies.
|
CH/DH scheme |
Pipe section heat losses, W per customer |
|
|||
|
A External pipework |
B Internal pipework |
C Pipework within customer demise |
Total |
Source |
|
|
All UK, Mean |
689 |
Not measured |
>689 |
(BEIS 2018) |
|
|
Example scheme Poor |
615 |
Not measured |
615 |
(BRE 2015) |
|
|
Example scheme Typical |
438 |
Not measured |
438 |
(BRE 2015) |
|
|
Example scheme Best |
175 |
Not measured |
175 |
(BRE 2015) |
|
|
The London scheme |
n/a |
90 |
~30 |
90* |
MF |
|
SAP default |
23 |
Not calculated |
~44 |
23* |
(BRE 2012) |
*The total, excluding ‘C’ losses, is presented as this is comparable to the other benchmarks.
Measured distribution heat losses for national, example schemes, and for the London scheme. Compared to SAP default value. Pipe sections A, B & C are defined in the Max:R+I webpage.
- We note that the SAP default efficiencies are much better than the ‘very good’ London scheme and national measured data.
- Current regulations have no requirement for an "as built" test of actual heat loss.
- We feel that this process is causing a misrepresentation of the benefits and limitations of district and communal heating as a technology for the greater good. It may also be limiting innovation within the industry.
- We hope that by defining these metrics and by sharing this data we can start an open conversation on real-life efficiencies.
- If you are a designer, operator or client with a view on these metrics and method, please let us know. Even better, if you have measured data of your own, please share it publically.


.jpg)
Comments
Add a comment